Consider the standard normal curve given.
A graph shows the horizontal axis numbered 20...

Mathematics, 15.04.2020 23:52 yourgirlmaya
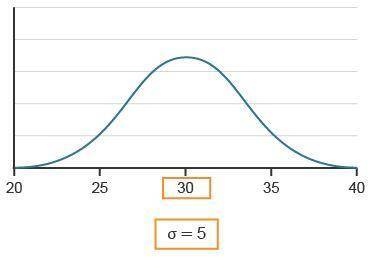
Consider the standard normal curve given.
A graph shows the horizontal axis numbered 20 to 40. 30 is highlighted in an orange outline. Variance = 5 and is highlighted in an orange outline. The line shows an upward trend to from 20 to 30 then a downward trend from 30 to 40.
The mean is __.
The standard deviation is __.
The data point 37 is __ one standard deviation from the mean.

Answers: 2


Other questions on the subject: Mathematics
Mathematics, 21.06.2019 13:30, calebnlocke
What is the vertical asymptotes of the function f(x)=x-2/x*2-3x-4
Answers: 1
Mathematics, 21.06.2019 18:00, leianagaming
Describe the relationship between the angles of similar triangles and the sides of similar triangles
Answers: 1
Mathematics, 21.06.2019 18:00, SunsetPrincess
Solve this equation using substitution. {4x + y = −2} {4x + 6y = 44}
Answers: 1
Mathematics, 21.06.2019 21:30, Kizmit1423
How does reflecting or rotating a figure change the interior angles of the figure?
Answers: 2
You know the right answer?
Questions in other subjects:
Mathematics, 17.02.2021 20:30
Mathematics, 17.02.2021 20:30

History, 17.02.2021 20:30
Mathematics, 17.02.2021 20:30


History, 17.02.2021 20:30


