
Mathematics, 08.04.2020 16:20 ale1910
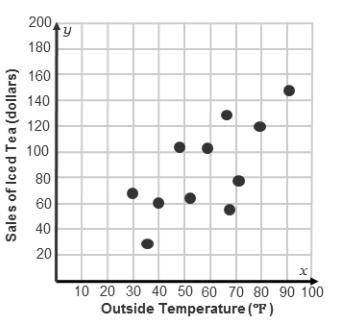
A graph has outside Temperature (degrees Fahrenheit) on the x-axis, and sales of iced tea (dollars) on the y-axis. Points are at (30, 69), (71, 78), (37, 30), (48, 103), (40, 60), (80, 120), (92, 145).
Which two points should the trend line go through to best represent the data given in this scatterplot?
(30, 69) and (71, 78)
(37, 30) and (48, 103)
(40, 60) and (71, 78)
(40, 60) and (80,120)

Answers: 3


Other questions on the subject: Mathematics
Mathematics, 22.06.2019 01:00, carolhubble
The balance of susu's savings account can be represented by the variable b. the inequality describing her balance b > $30 . which could be a solution to the inequality?
Answers: 2
Mathematics, 22.06.2019 01:00, allysongonzalezlove0
Ineed to know how to write question one in mathematical terms
Answers: 1
Mathematics, 22.06.2019 02:00, citlalli30
Sammie has 3 times as many goldfish as nora. nora has 4 goldfish. how many goldfish do sammie and nora have in all?
Answers: 2
You know the right answer?
A graph has outside Temperature (degrees Fahrenheit) on the x-axis, and sales of iced tea (dollars)...
Questions in other subjects:
Mathematics, 15.12.2021 02:10


Mathematics, 15.12.2021 02:10

Geography, 15.12.2021 02:10

Arts, 15.12.2021 02:20


