Mathematics, 15.12.2021 02:10 BigElote
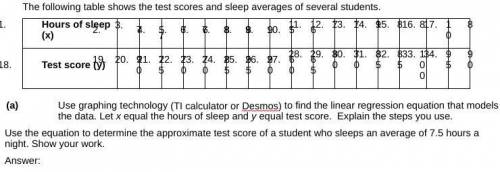
Use graphing technology (TI calculator or Desmos) to find the linear regression equation that models the data. Let x equal the hours of sleep and y equal test score. Explain the steps you use. Use the equation to determine the approximate test score of a student who sleeps an average of 7.5 hours a night. Show your work. (please No nonsense answers, If you don't know it please go to a different question)


Answers: 1


Other questions on the subject: Mathematics

Mathematics, 22.06.2019 00:10, sonnyboi2305
Of of at a : $6, $8, $7, $6, $5, $7, $5, $7, $6, $28, $30 is?ato .ato .ato .ato .
Answers: 3

Mathematics, 22.06.2019 01:00, khloenm309
Which graph shows the solution to the system of linear inequalities? y-4t< 4 y
Answers: 1


You know the right answer?
Use graphing technology (TI calculator or Desmos) to find the linear regression equation that models...
Questions in other subjects:

Mathematics, 07.12.2020 21:10


History, 07.12.2020 21:10

Social Studies, 07.12.2020 21:10


History, 07.12.2020 21:10

History, 07.12.2020 21:10

Mathematics, 07.12.2020 21:10


Chemistry, 07.12.2020 21:10


