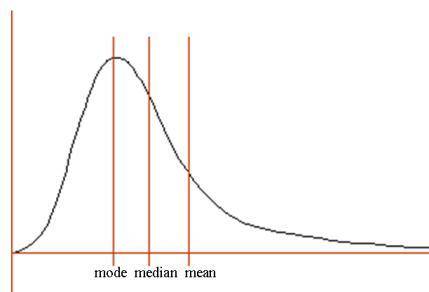
Which measure of central tendency BEST represents the data shown in the distribution?
T...

Mathematics, 18.03.2020 16:44 seonna
Which measure of central tendency BEST represents the data shown in the distribution?
The question is in the attachment!

Answers: 3


Other questions on the subject: Mathematics
Mathematics, 21.06.2019 15:20, ibidnnudny2584
The data in the table represent the height of an object over time. which model best represents the data? height of an object time (seconds) height (feet) 05 1 50 2 70 3 48 quadratic, because the height of the object increases or decreases with a multiplicative rate of change quadratic, because the height increases and then decreases exponential, because the height of the object increases or decreases with a multiplicative rate of change exponential, because the height increases and then decreases
Answers: 1
Mathematics, 21.06.2019 16:00, vjacksongonzalez
You eat 8 strawberries and your friend eats 12 strawberries from a bowl. there are 20 strawberries left. which equation and solution give the original number of strawberries?
Answers: 1
You know the right answer?
Questions in other subjects:

Physics, 02.09.2021 08:10


Chemistry, 02.09.2021 08:10
Biology, 02.09.2021 08:10
Mathematics, 02.09.2021 08:10

Mathematics, 02.09.2021 08:10


