
Mathematics, 17.03.2020 15:40 itzzarosario12
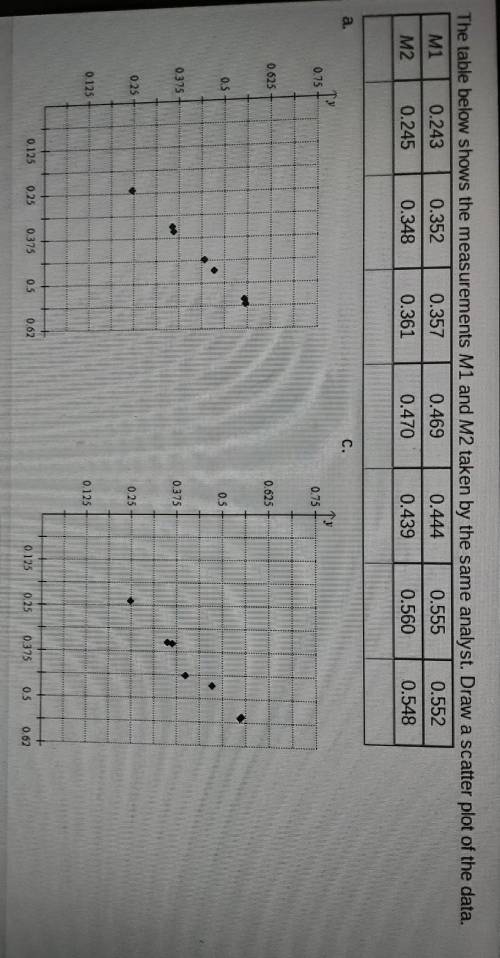
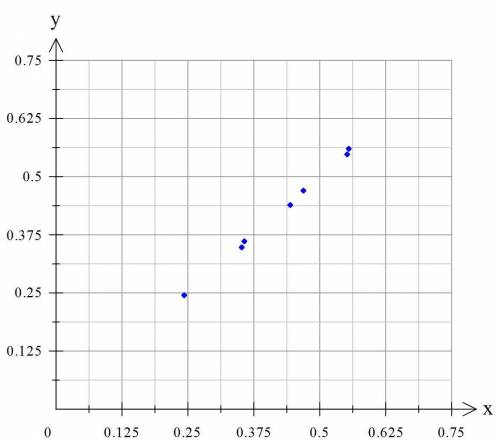
The table below shows the measurements M1 and M2 taken by the same analyst. Draw a scatter plot of the data.

Answers: 2


Other questions on the subject: Mathematics
Mathematics, 21.06.2019 22:00, wazzuphottie1999
Iam at home. /: i am playing video games. translate the following statement into symbolic form.
Answers: 2
You know the right answer?
The table below shows the measurements M1 and M2 taken by the same analyst. Draw a scatter plot of t...
Questions in other subjects:


