An employee compiled sales data for a
company once each month. The scatter plot
below sh...

Mathematics, 13.03.2020 10:55 raishagibson
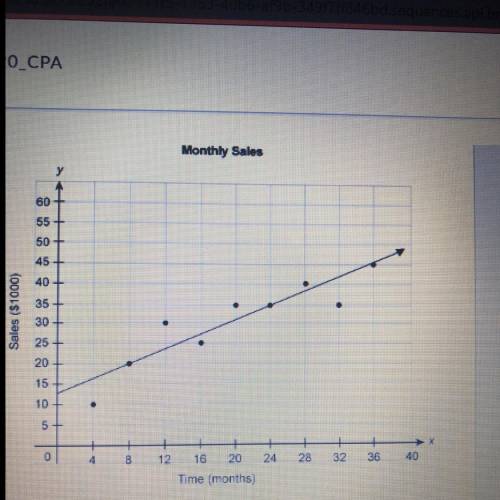
An employee compiled sales data for a
company once each month. The scatter plot
below shows the sales in multiples of $1000)
for the company over time (in months). The
equation represents the linear model for this
data.
y = 0.94x + 12.5

Answers: 1


Other questions on the subject: Mathematics
Mathematics, 21.06.2019 12:40, kchugues1241
Aparallelogram has two side lengths of 5 units. three of its sides have equations y = 0, y = 2, y = 2x. find the equation of the fourth side.
Answers: 1
Mathematics, 21.06.2019 18:00, lnbrown9018
Find the number of liters in 12.8 gal of gasoline. round to the nearest hundredths
Answers: 2
Mathematics, 21.06.2019 22:30, brooklyn4932
1.based of the diagrams what is the the value of x? 2.how would you verify your answer for x
Answers: 1
You know the right answer?
Questions in other subjects:


Arts, 21.04.2020 17:24

Mathematics, 21.04.2020 17:24
Mathematics, 21.04.2020 17:24


