
Mathematics, 11.03.2020 02:30 ethannila
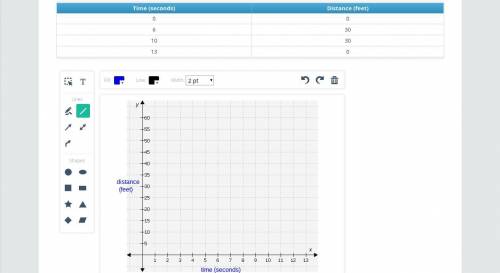
Draw a graph that models the relationship between time and the runner’s distance from the starting position as observed in the video. Use the data in the table to create the graph of the relationship. Be sure to include appropriate axis labels, intervals, and units.

Answers: 2


Other questions on the subject: Mathematics
Mathematics, 21.06.2019 21:00, mscharris66
Simplify. 4+3/7x-2-2/7x a. 2-5/7x b. 6-1/7x c. 2+1/7x d. 6+5/7x
Answers: 1
Mathematics, 21.06.2019 22:30, izabelllreyes
Gabrielle's age is two times mikhail's age. the sum of their ages is 84. what is mikhail's age?
Answers: 2
Mathematics, 22.06.2019 00:40, Abrow484
Afootball quarterback has two more chances to throw a touchdown before his team is forced to punt the ball. he misses the receiver on the first throw 25% of the time. when his first throw is incomplete, he misses the receiver on the second throw 15% of the time. what is the probability of not throwing the ball to a receiver on either throw?
Answers: 2
Mathematics, 22.06.2019 01:10, Weser17
Jobs and productivity! how do retail stores rate? one way to answer this question is to examine annual profits per employee. the following data give annual profits per employee (in units of 1 thousand dollars per employee) for companies in retail sales. assume σ ≈ 4.0 thousand dollars. 3.7 6.7 3.6 8.5 7.5 5.9 8.7 6.4 2.6 2.9 8.1 −1.9 11.9 8.2 6.4 4.7 5.5 4.8 3.0 4.3 −6.0 1.5 2.9 4.8 −1.7 9.4 5.5 5.8 4.7 6.2 15.0 4.1 3.7 5.1 4.2 (a) use a calculator or appropriate computer software to find x for the preceding data. (round your answer to two decimal places.) thousand dollars per employee (b) let us say that the preceding data are representative of the entire sector of retail sales companies. find an 80% confidence interval for μ, the average annual profit per employee for retail sales. (round your answers to two decimal places.) lower limit -- thousand dollars upper limit -- thousand dollars (c) let us say that you are the manager of a retail store with a large number of employees. suppose the annual profits are less than 3 thousand dollars per employee. do you think this might be low compared with other retail stores? explain by referring to the confidence interval you computed in part (b). yes. this confidence interval suggests that the profits per employee are less than those of other retail stores. no. this confidence interval suggests that the profits per employee do not differ from those of other retail stores. correct: your answer is correct. (d) suppose the annual profits are more than 6.5 thousand dollars per employee. as store manager, would you feel somewhat better? explain by referring to the confidence interval you computed in part (b). yes. this confidence interval suggests that the profits per employee are greater than those of other retail stores. no. this confidence interval suggests that the profits per employee do not differ from those of other retail stores. (e) find an 95% confidence interval for μ, the average annual profit per employee for retail sales. (round your answers to two decimal places.) lower limit 3.75 incorrect: your answer is incorrect. thousand dollars upper limit 6.41 incorrect: your answer is incorrect. thousand dollars
Answers: 3
You know the right answer?
Draw a graph that models the relationship between time and the runner’s distance from the starting p...
Questions in other subjects:


Chemistry, 29.06.2019 02:00
Social Studies, 29.06.2019 02:00


