Linear functions are expressed by data in a table and by a graph. select all that apply.
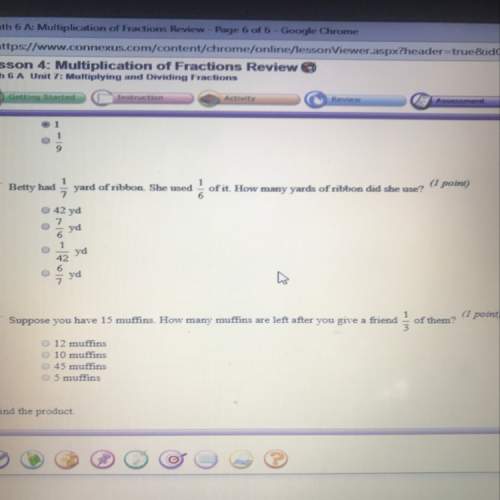
...

Mathematics, 08.10.2019 20:20 shawny5
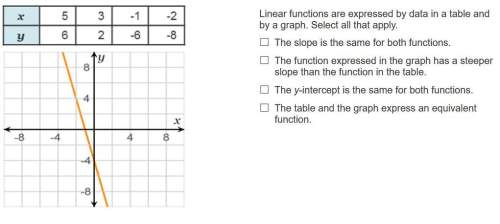
Linear functions are expressed by data in a table and by a graph. select all that apply.
a. the slope is the same for both functions.
b. the function expressed in the graph has a steeper slope than the function in the table.
c. the y-intercept is the same for both functions.
d. the table and the graph express an equivalent function.

Answers: 1


Other questions on the subject: Mathematics
Mathematics, 21.06.2019 18:30, andrewblack033
In the following diagram it is given that dec, ab || dc, ad || eb, and ad is congruent to bc. a)why isn't abc a parallelogram even though it has a pair of parallel sides and a pair of congruent sides b)explain why be must be congruent to bc. further explain what type of triangle this makes triangle abc and what it tells you about angle 1 and angle 2c) finally why must angle 3 be congruent to angle 1? further, explain why we know that angle 3 is congruent to angle 2
Answers: 1
Mathematics, 22.06.2019 01:00, rexerlkman4145
Mia’s gross pay is 2953 her deductions total 724.15 what percent if her gross pay is take-home pay
Answers: 2
Mathematics, 22.06.2019 05:30, WampWamp8751
You leave a $4 tip on a $24 bill at a resturaunt. to the nearest percent gratuity did you pay
Answers: 1
You know the right answer?
Questions in other subjects:


Mathematics, 09.03.2020 17:38


