20 !
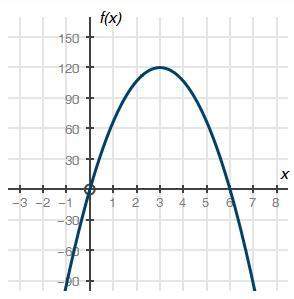
the graph below shows a company's profit f(x), in dollars, depending on the price of pen...

Mathematics, 15.07.2019 04:10 meg12331
20 !
the graph below shows a company's profit f(x), in dollars, depending on the price of pens x, in dollars, being sold by the company:
part a: what do the x-intercepts and maximum value of the graph represent? what are the intervals where the function is increasing and decreasing, and what do they represent about the sale and profit? (6 points)
part b: what is an approximate average rate of change of the graph from x = 3 to x = 5, and what does this rate represent?

Answers: 1


Other questions on the subject: Mathematics
Mathematics, 21.06.2019 15:30, mag331
Afruit stand has to decide what to charge for their produce. they need $10 for 4 apples and 4 oranges. they also need $15 for 6 apples and 6 oranges. we put this information into a system of linear equations. can we find a unique price for an apple and an orange?
Answers: 2
Mathematics, 21.06.2019 16:00, gavianacandelar8522
Enter the number of complex zeros for the polynomial function in the box. f(x) = x+ + 5x² +6
Answers: 2
Mathematics, 21.06.2019 20:30, Gabyngreen
What is the interquartile range of this data set? 2, 5, 9, 11, 18, 30, 42, 48, 55, 73, 81
Answers: 1
You know the right answer?
Questions in other subjects:


