
Mathematics, 25.06.2019 20:00 Jaylen52709
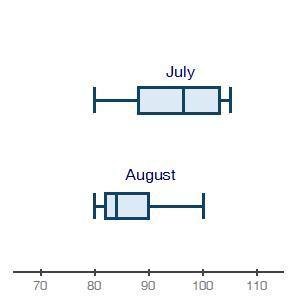
The box plots below show the average daily temperatures in july and august for a u. s. city: two box plots shown. the top one is labeled july. minimum at 80, q1 at 88, median at 96, q3 at 103, maximum at 105. the bottom box plot is labeled august. minimum at 80, q1 at 82, median at 84, q3 at 90, maximum at 100 what can you tell about the means for these two months? (1 point) select one: a. the august high is above the july median. this makes it hard to know about the means. b. both months have the same low temperature. this makes it hard to know about the means. c. it is unlikely, but possible that the july mean could be higher. d. there is no way to tell what the means are.

Answers: 1


Other questions on the subject: Mathematics
Mathematics, 21.06.2019 12:30, vanessam16
Listed below are the measured radiation absorption rates? (in w/kg) corresponding to 11 cell phones. use the given data to construct a no plot and identify the 5- number summary
Answers: 2
Mathematics, 21.06.2019 13:00, Kennedy3449
1. what are the missing reasons in the proof 2. it's in the second picture and 3
Answers: 1
You know the right answer?
The box plots below show the average daily temperatures in july and august for a u. s. city: two bo...
Questions in other subjects:


Mathematics, 24.01.2020 20:31


