
Mathematics, 04.02.2020 10:43 kaylynn77
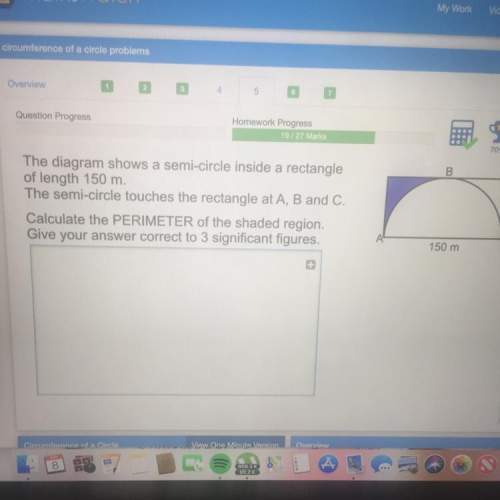
The diagram shows a semi circle inside a rectangle of length 150 m. the semi circle touches the rectangle at a b and c. calculate the perimeter of the shaded region.

Answers: 3


 \
\


Other questions on the subject: Mathematics
Mathematics, 21.06.2019 18:00, evarod
The given dot plot represents the average daily temperatures, in degrees fahrenheit, recorded in a town during the first 15 days of september. if the dot plot is converted to a box plot, the first quartile would be drawn at __ , and the third quartile would be drawn at link to the chart is here
Answers: 1
Mathematics, 21.06.2019 21:00, lucky1silky
If u good at math hit me up on insta or sum @basic_jaiden or @ and
Answers: 1
You know the right answer?
The diagram shows a semi circle inside a rectangle of length 150 m. the semi circle touches the rect...
Questions in other subjects:

Mathematics, 15.03.2020 22:49
Mathematics, 15.03.2020 22:49

Social Studies, 15.03.2020 22:49


Health, 15.03.2020 22:50


