
Mathematics, 28.01.2020 21:06 april861
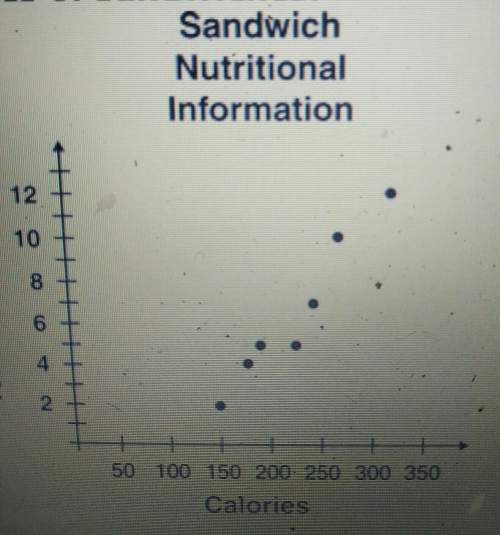
The graphy below shows the relationshio between the numbers of calories and the total amount in fat in different types of sandwiches. which trendnbest describes the relationshio in the graph a.) the points have a negative trend and are nonlinear b ) the points have a negative trend and are most likely linear c.) the points have a positive trend and are most likely linear d ) the points have a positive trend and are nonlinear

Answers: 3


Other questions on the subject: Mathematics
Mathematics, 21.06.2019 18:00, xojade
Assume that the weights of quarters are normally distributed with a mean of 5.67 g and a standard deviation 0.070 g. a vending machine will only accept coins weighing between 5.48 g and 5.82 g. what percentage of legal quarters will be rejected? round your answer to two decimal places.
Answers: 1
Mathematics, 21.06.2019 19:00, notsosmart249
The focus of parabola is (-4, -5), and its directrix is y= -1. fill in the missing terms and signs in parabolas equation in standard form
Answers: 1
Mathematics, 22.06.2019 02:40, torybobadilla
Explain how the quotient of powers was used to simplify this expression.
Answers: 1
You know the right answer?
The graphy below shows the relationshio between the numbers of calories and the total amount in fat...
Questions in other subjects:

Mathematics, 02.12.2020 09:20
English, 02.12.2020 09:20
Mathematics, 02.12.2020 09:20
Mathematics, 02.12.2020 09:20

Biology, 02.12.2020 09:20
English, 02.12.2020 09:20


