

For problems 1 – 6, graph each function. label the vertex and axis of symmetry.
1. y=x^...

Mathematics, 27.09.2019 12:00 leandrogarin37p2g5ds
For problems 1 – 6, graph each function. label the vertex and axis of symmetry.
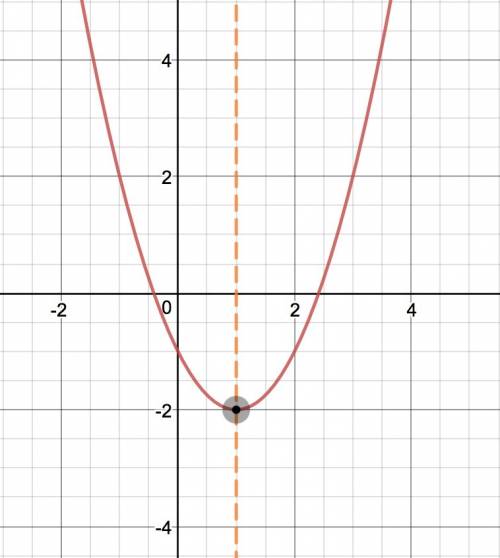
1. y=x^2-2x-1
2. y-3=(x+2)^2
3. y=(x+3)(x-4)
4. y=2x^2-12x-19
5. y-9=-5(x-2)^2
6. y=-3x(x-2)

Answers: 1


Other questions on the subject: Mathematics
Mathematics, 21.06.2019 18:30, gonzaloc
Draw a tape diagram to represent each situation. for some of the situations, you need to decide what to represent with a variable andre bakes 9 pans of brownies. he donates 7 pans to the school bake sale and keeps the rest to divide equally among his class of 30 students
Answers: 2
Mathematics, 21.06.2019 20:30, catcatscats122
Write two point-slope equations for the line passing through the points (6, 5) and (3, 1)
Answers: 1
Mathematics, 21.06.2019 23:00, janeou17xn
The equation shown below represents function f. f(x)= -2x+5 the graph shown below represents function g. which of the following statements is true? a. over the interval [2, 4], the average rate of change of f is the same as the average rate of change of g. the y-intercept of function f is less than the y-intercept of function g. b. over the interval [2, 4], the average rate of change of f is greater than the average rate of change of g. the y-intercept of function f is greater than the y-intercept of function g. c. over the interval [2, 4], the average rate of change of f is the same as the average rate of change of g. the y-intercept of function f is greater than the y-intercept of function g. d. over the interval [2, 4], the average rate of change of f is less than the average rate of change of g. the y-intercept of function f is the same as the y-intercept of function g.
Answers: 1
You know the right answer?
Questions in other subjects:

Mathematics, 05.02.2020 12:55


Business, 05.02.2020 12:55

Physics, 05.02.2020 12:55

Mathematics, 05.02.2020 12:55


