
History, 15.06.2021 01:50 pablogonzaleztellez
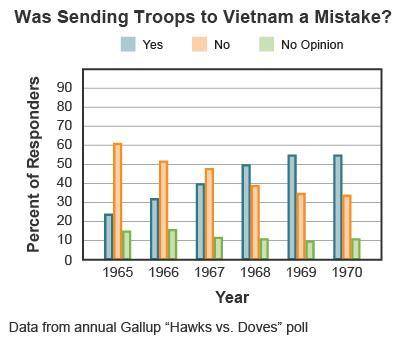
Study the graph showing US public opinion from 1965 to 1970.
A triple bar graph titled Was Sending Troops to Vietnam a Mistake? The x-axis is labeled Year from 1965 to 1970. The y-axis is labeled Percent of Responders from 0 to 90. The left bar is labeled yes. The middle bar is labeled no. The right bar is labeled no opinion. In 1965, over 20 percent say yes, 60 percent say no, and 15 percent have no opinion. In 1967, 40 percent say yes almost 50 percent say no, and 10 percent have no opinion. In 1970, over 50 percent say yes, over 30 percent say no, and 10 percent have no opinion.
Which statement about the Vietnam War is supported by the data in the graph?
The war was increasingly unpopular.
The war’s success led to greater support.
The war was of little importance to most Americans.
The war’s support did not change drastically over time.

Answers: 3


Other questions on the subject: History
History, 22.06.2019 09:30, merrickrittany
What was true of public schools started by republicans across the south
Answers: 1
History, 22.06.2019 11:00, jeffersonpaul283
How do we make changes to the us constitution? a. through presidential order. b. through direct primary elections. c. through the amendment process. d. we can't!
Answers: 1
History, 22.06.2019 12:00, goalltheway4768
What is roosevelt’s corollary ? where did it specifically deal with?
Answers: 1
You know the right answer?
Study the graph showing US public opinion from 1965 to 1970.
A triple bar graph titled Was Sending...
Questions in other subjects:

Mathematics, 17.10.2019 23:30


Social Studies, 17.10.2019 23:30

World Languages, 17.10.2019 23:30
Mathematics, 17.10.2019 23:30
History, 17.10.2019 23:30


