
Biology, 20.09.2020 19:01 HeyItsCookie9605
Select the correct answer.
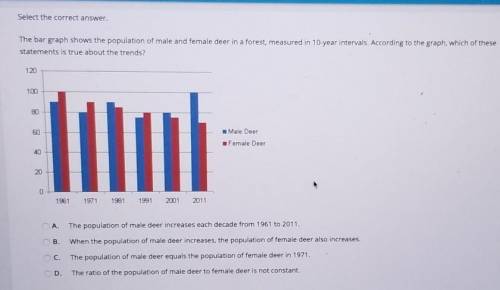
The bar graph shows the population of male and female deer in a forest, measured in 10-year intervals. According to the graph, which of these
statements is true about the trends?
120
100
80
60
Male Deer
Female Deer
40
20
0
1961
1971
1981
1991
2001
2011
A.
The population of male deer increases each decade from 1961 to 2011.
B.
When the population of male deer increases, the population of female deer also increases.
C.
The population of male deer equals the population of female deer in 1971.
D.
The ratio of the population of male deer to female deer is not constant.

Answers: 1


Other questions on the subject: Biology
Biology, 22.06.2019 11:10, tiannahwlit
Look at the photo of the leaf, which term best describes this leaf ? a-simple. b-parallel. c-lobed. d-tooth.
Answers: 2
Biology, 22.06.2019 12:40, charlesgtro7066
In which part of the body is a ball-and-socket joint found?
Answers: 2
You know the right answer?
Select the correct answer.
The bar graph shows the population of male and female deer in a forest...
Questions in other subjects:

Physics, 24.10.2021 07:40

Medicine, 24.10.2021 07:40


Mathematics, 24.10.2021 07:40

History, 24.10.2021 07:40

English, 24.10.2021 07:40


