
Social Studies, 27.07.2019 05:30 amariyanumber1923
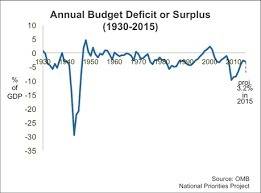
This chart represents surpluses and deficits in the federal budget since 1930. what situation would have most likely accounted for the period in from the mid-1990s to 2000?

Answers: 1


Other questions on the subject: Social Studies
Social Studies, 22.06.2019 03:30, maustin5323
Read the graph that displays interest and total payments on a loan. banks make the most money and take the most risk with an interest rate of 5 percent. 10 percent. 15 percent 18 percent.
Answers: 2
Social Studies, 22.06.2019 22:00, atsuedem974
This cartoon appeared in 1916. the topic of the cartoon isa)the reason for the start of world war i. b)the success of us submarines in world war i. c)the military alliance between germany and mexico. d)the attitude in the us towards submarine warfare in world
Answers: 2
You know the right answer?
This chart represents surpluses and deficits in the federal budget since 1930. what situation would...
Questions in other subjects:


