The graph shows the price of a good compared to the quantity demanded.
this graph demons...

Social Studies, 27.10.2019 12:43 sky724
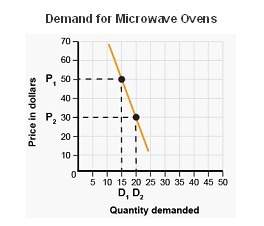
The graph shows the price of a good compared to the quantity demanded.
this graph demonstrates how
the amount produced slightly changes with the price.
the amount produced greatly changes with the price.
the amount consumed slightly changes with the price.
the amount consumed greatly changes with the price.

Answers: 2


Other questions on the subject: Social Studies
Social Studies, 22.06.2019 22:30, QueenNerdy889
Why did working women earn one-thrid to one-half as much as men
Answers: 2
Social Studies, 23.06.2019 01:10, Hannahrose911
What does one prolonged blast and one short blast mean?
Answers: 2
You know the right answer?
Questions in other subjects:
Social Studies, 19.10.2021 20:00

Mathematics, 19.10.2021 20:00
Mathematics, 19.10.2021 20:00

Mathematics, 19.10.2021 20:00
English, 19.10.2021 20:00


