
Social Studies, 31.01.2020 22:55 lazavionadams81
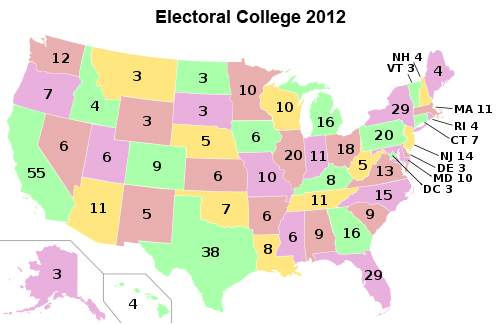
In the election of 2008, florida had 27 electoral votes. how do you explain the data shown on this map?
*it shows a map and florida is colored pink and has a 29 written in it.
a. the state lost representatives and electoral votes because census data revealed a population decrease.
b. data on this map reflect changes in federal legislation regarding the organization of the electoral system.
c. it is a mistake of the cartographer, as florida still has 27 electoral votes for upcoming presidential elections.
d. florida gained representatives and thus electoral votes because of census data showing population increase.

Answers: 2


Other questions on the subject: Social Studies
Social Studies, 23.06.2019 03:20, TheLuciferOG4558
How has congress added to the president’s role as chief economic planner over the years?
Answers: 1
Social Studies, 24.06.2019 04:50, bangtann77
Lina and allita are swimming towards a raft when lina roughly pushes allita's head underwater, in order to get there first. as soon as allita can speak, after coming up for air, she says, “go find yourself another best friend! ” (1) lina is showing aggression.
Answers: 2
You know the right answer?
In the election of 2008, florida had 27 electoral votes. how do you explain the data shown on this m...
Questions in other subjects:


History, 27.08.2019 00:30


