
Social Studies, 07.03.2021 06:40 shawntawright1
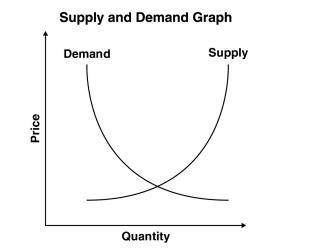
How would this graph MOST likely change if the price of a complementary good were to increase?
A. The demand curve would shift to the left
B. The demand curve would shift to the right.
C. The supply curve would shift to the left.
D. The supply curve would shift to the right

Answers: 1


Other questions on the subject: Social Studies
Social Studies, 23.06.2019 05:00, nyameneak
Which of the following statements best describes relations between india and pakistan? a. the countries have had peaceful relations since the partition of india. b. the countries have an ongoing trade dispute with bangladesh. c. the countries have had conflicts over the region of kashmir. d. the countries have agreed not to develop nuclear weapons.
Answers: 1
Social Studies, 23.06.2019 11:00, kiwipitts9201
Which reason best explains the movement of georgia capitals as shown on the map
Answers: 1
You know the right answer?
How would this graph MOST likely change if the price of a complementary good were to increase?
A. T...
Questions in other subjects:

History, 18.05.2021 23:00

Mathematics, 18.05.2021 23:00

Physics, 18.05.2021 23:00


