
Social Studies, 05.03.2021 18:30 genesist720
Study the maps showing population movement during the Great Migration.
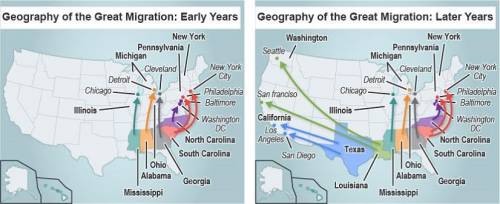
On the left is a map titled Geography of the Great Migration: Early Years. States highlighted from left to right are Mississippi, Alabama, Georgia, North Carolina, and South Carolina. People from North Carolina migrated to Washington D C and Baltimore. People from South Carolina migrated to Philadelphia and New York City. People from Georgia migrated to Cleveland. People from Alabama migrated to Detroit. People from Mississippi migrated to Chicago. On the right is a map titled Geography of the Great Migration: Later Years. States highlighted left to right are Texas, Louisiana, Mississippi, Alabama, Georgia, South Carolina, and North Carolina. In addition to the Early Years migration, people from Texas migrated to Los Angeles and San Diego. People from Louisiana migrated to San Francisco and Seattle.
Which statement explains what the maps show about how migration changed from the early years to the later years?
In later years, people migrated to Texas.
In later years, people migrated to Northern cities.
In later years, people migrated to Western states.
In later years, people migrated from the North to the West Coast.

Answers: 1


Other questions on the subject: Social Studies
Social Studies, 22.06.2019 03:00, amadileaks
Explain how tectonic plate movement creates geological events and features.
Answers: 3
Social Studies, 22.06.2019 06:30, shelly1969
According to justice brown's opinion, social equality must be the result of what three factors?
Answers: 2
Social Studies, 22.06.2019 08:20, nerdywolf2003
Name three things the framers of the constitution did to keep the federal government or any part of it from becoming too powerful.
Answers: 1
Social Studies, 22.06.2019 16:30, s1004019694
On a supply and demand graph, equilibrium is the point where the two curves meet. the supply curve begins. the supply curve ends. the demand curve ends.
Answers: 3
You know the right answer?
Study the maps showing population movement during the Great Migration.
On the left is a map titled...
Questions in other subjects:


History, 06.05.2020 08:33

Chemistry, 06.05.2020 08:33

Mathematics, 06.05.2020 08:33

History, 06.05.2020 08:33


