
Social Studies, 01.03.2021 02:10 haitch
(01.04 MC)
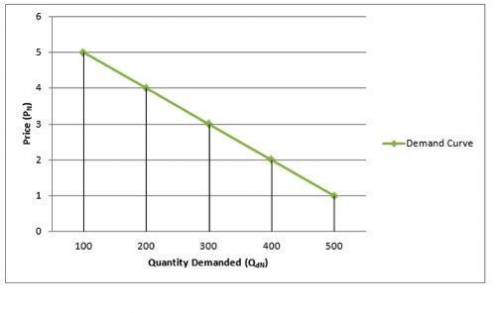
Graph with x axis labeled Quantity Demanded and numbered in hundreds, 100 to 500. Y axis is Price, with prices 0 to 6. A line representing the Demand Curve starts at 100, 5 and drops at an angle down to 500, 1. Dashed lines extend from the x and y axes to point A 10, 15. Solid lines extend upward from the x axis to the green line at points 100, 5, 200, 4, 300, 3, 400, 2, and 500, 1.
© Public Domain
Based on the graph, what would happen if customers demanded 550 units of this product?
The price would drop to 0.5.
The quantity would be 0.
The quantity would be 0.5.
The price would rise to 2.

Answers: 1


Other questions on the subject: Social Studies
Social Studies, 21.06.2019 23:30, natalie2sheffield
If you had been an american colonist, would you have supported the declaration of independence? why or why not?
Answers: 1
Social Studies, 22.06.2019 01:00, BlehBlehBlehBleh
The people of are overwhelmingly arab but are divided by religion.
Answers: 1
Social Studies, 22.06.2019 09:10, ginger87771
Which of the following is a problem in the health care system of the united states? a. too many doctors in rural areas b. too many doctors who are general practitioners c. fraud d. costs that are too low
Answers: 2
You know the right answer?
(01.04 MC)
Graph with x axis labeled Quantity Demanded and numbered in hundreds, 100 to 500. Y axis...
Questions in other subjects:

Mathematics, 04.12.2020 14:00

Mathematics, 04.12.2020 14:00


Mathematics, 04.12.2020 14:00

English, 04.12.2020 14:00
Mathematics, 04.12.2020 14:00
Mathematics, 04.12.2020 14:00


