
Social Studies, 04.01.2021 22:50 morgannwaldrupp
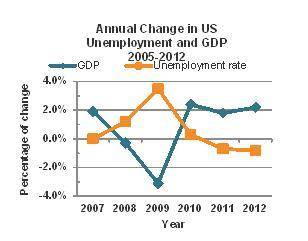
This graph shows changes in GDP and the unemployment rate in the United States in recent years. In what year would someone looking for work have had the hardest time finding a job?
A. 2008
B. 2009
C. 2011
D. 2012

Answers: 2


Other questions on the subject: Social Studies
Social Studies, 21.06.2019 13:30, smelcher3900
The majority of the republican party during the reconstruction was called:
Answers: 1
Social Studies, 23.06.2019 15:00, tytybruce2
How did the location of the arabian peninsula the muslims conquer territory beyond the arabian penensula
Answers: 2
You know the right answer?
This graph shows changes in GDP and the unemployment rate in the United States in recent years. In w...
Questions in other subjects:


Arts, 08.11.2020 02:30

Mathematics, 08.11.2020 02:30

History, 08.11.2020 02:30


