
Social Studies, 04.12.2020 21:50 gerkera88
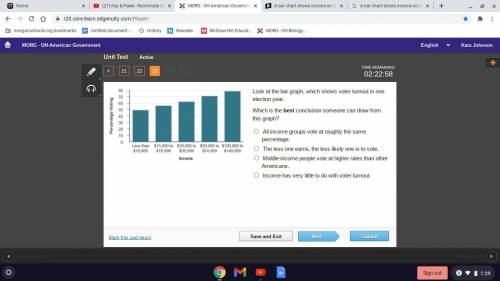
A bar chart shows income on the x axis and percentage voting on the y axis. Less than 10,000 dollars, 49. 15,000 to 19,999 dollars, 56. 30,000 to 39,999 dollars, 62. 50,000 to 74,999, 70. 100,000 to 149,999, 79.
Look at the bar graph, which shows voter turnout in one election year.
Which is the best conclusion someone can draw from this graph?
All income groups vote at roughly the same percentage.
The less one earns, the less likely one is to vote.
Middle-income people vote at higher rates than other Americans.
Income has very little to do with voter turnout.

Answers: 1


Other questions on the subject: Social Studies
Social Studies, 23.06.2019 03:30, kimjooin02
What specific words do you hear in dr. king’s speech that are powerful
Answers: 1
Social Studies, 23.06.2019 05:30, neariah24
Read an excerpt from a speech by benito mussolini. italy! italy! entirely and universally fascist! the italy of the blackshirt revolution, rise to your feet; let the cry of your determination rise to the skies and reach our soldiers in east africa. let it be a comfort to those who are about to fight. let it be an encouragement to our friends and a warning to our enemies. it is the cry of italy which goes beyond the mountains and the seas out into the great world. it is the cry of justice and of victory. how does this excerpt support the idea that mussolini was a charismatic dictator? it shows how he used persuasive language to rally citizens. it explains his use of an aggressive foreign policy in europe. it shows how he used a secret police force to terrorize citizens. it explains how he used education to indoctrinate young people.
Answers: 2
You know the right answer?
A bar chart shows income on the x axis and percentage voting on the y axis. Less than 10,000 dollars...
Questions in other subjects:


Mathematics, 17.08.2019 22:20

Health, 17.08.2019 22:20

Computers and Technology, 17.08.2019 22:20


