Pie chart

Social Studies, 17.11.2020 18:00 moran14
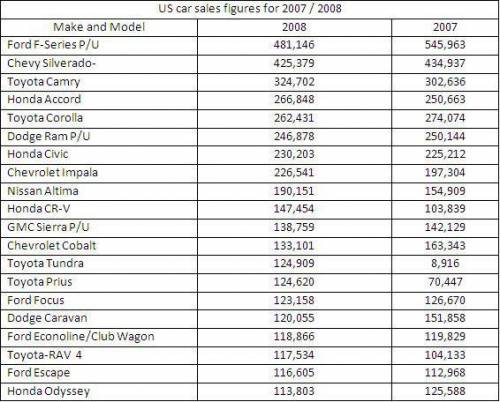
What chart would best show the change over time from 2007 to 2008?
a.
Pie chart
b.
Bar chart
c.
Line chart
d.
Data chart

Answers: 2


Other questions on the subject: Social Studies
Social Studies, 22.06.2019 14:30, ayoismeisalex
At 3476 kilometer the moon's diameter is slightly less than the distance across from what
Answers: 1
Social Studies, 22.06.2019 16:10, ashtynbursiaga
Personal finance skills have the most significant impact on an individual’s
Answers: 3
Social Studies, 22.06.2019 22:50, nidiavega2009
How many states were there when the constitution was written?
Answers: 2
You know the right answer?
What chart would best show the change over time from 2007 to 2008?
a.
Pie chart
Pie chart
Questions in other subjects:


English, 26.04.2021 08:30

Mathematics, 26.04.2021 08:30
Social Studies, 26.04.2021 08:30

Mathematics, 26.04.2021 08:30
Mathematics, 26.04.2021 08:30
English, 26.04.2021 08:30
Mathematics, 26.04.2021 08:30


