
Social Studies, 04.11.2020 19:20 aperez4102
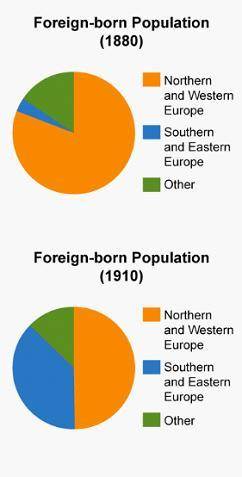
Look at the circle graphs, which describe the foreign-born (immigrant) population in the US in 1880 and 1910.
Which of these statements is the best interpretation of these two graphs?
A. Few people immigrated to the US from Southern and Eastern Europe between 1880 and 1910.
B. Throughout the second half of the 1800s, almost all new immigrants in the US were Western Europeans.
C. In 1910, more residents of the US had ancestors from Southern and Eastern Europe than from other parts of Europe.
D. By 1910, the US was attracting immigrants from all over Europe and other parts of the world.

Answers: 1


Other questions on the subject: Social Studies
Social Studies, 22.06.2019 09:30, gonzalesalexiaouv1bg
What would happen if people from different races were seperated today
Answers: 1
Social Studies, 22.06.2019 15:40, FlyToTheGalaxy
Experiment to investigate effect of medication on levels of stress in males and females. dependant variable?
Answers: 2
You know the right answer?
Look at the circle graphs, which describe the foreign-born (immigrant) population in the US in 1880...
Questions in other subjects:


History, 26.10.2020 17:20


Mathematics, 26.10.2020 17:20


