
Social Studies, 16.10.2020 01:01 noahalderman83
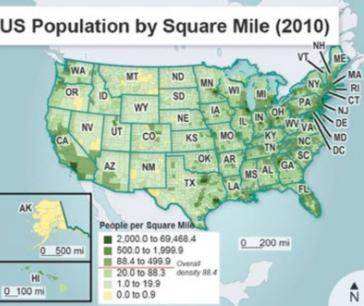
Examine the map showing US population distribution.
A map titled U S Population by Square Mile in 2010. A key notes the least amount of people to most amount of people from light to dark shading. Yellow shading is 0.0 to 0.9 people per square mile. Dark green shading is 2,000 to 69,468.4 people per square mile. A red line marks overall density is 88.4.
What conclusion can be drawn about the US population in 2010 from this map?
Texas had a lower population density than Montana.
New Jersey had a greater population than any other state.
Many Americans were migrating from the coasts to the interior.
The Northeast had the greatest population density in the nation.

Answers: 1


Other questions on the subject: Social Studies
Social Studies, 23.06.2019 05:30, slimt69561
1. describe at least 3 similarities or differences between homo habilis and australopithecus 2. describe at least 3 similarities or differences between cro-magnon and neanderthals.
Answers: 2
You know the right answer?
Examine the map showing US population distribution.
A map titled U S Population by Square Mile in 2...
Questions in other subjects:


Physics, 08.06.2021 02:30
Mathematics, 08.06.2021 02:30

Mathematics, 08.06.2021 02:40

Chemistry, 08.06.2021 02:40

English, 08.06.2021 02:40


