What is most likely on the graph above?
A-demand curve
B-supply curve
C-perfectly elast...

Social Studies, 20.09.2020 06:01 kittey7854
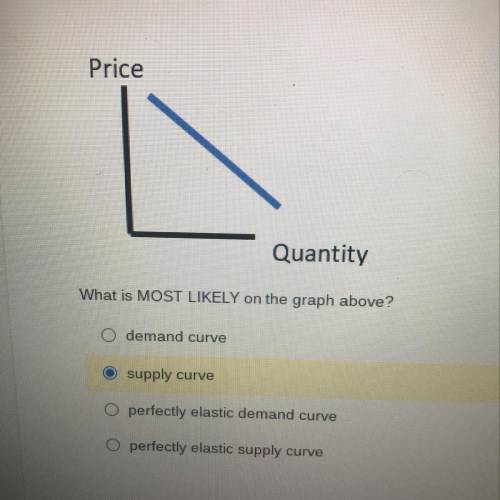
What is most likely on the graph above?
A-demand curve
B-supply curve
C-perfectly elastic demand curve
D-perfectly elastic supply curve

Answers: 3


Other questions on the subject: Social Studies
Social Studies, 22.06.2019 04:00, Morehollie7229
Cynthia writes computer programs for mobile phones and has received five job offers in the last week this is most likely because everfi
Answers: 1
Social Studies, 22.06.2019 14:30, maggie9459
In what ways did the compromise of 1850 and the kansas-nebraska act of 1854 differ from the missouri compromise? both compromises used the established 36°30′ parallel to determine if territories would become free or slave states. both compromises used the mason-dixon line to determine if the territories would become free or slave states. both compromises let territories use popular sovereignty to determine if they would become free or slave states. both compromises only granted congress the power to determine if territories would become free or slave states.
Answers: 3
You know the right answer?
Questions in other subjects:


Physics, 11.09.2019 02:10


