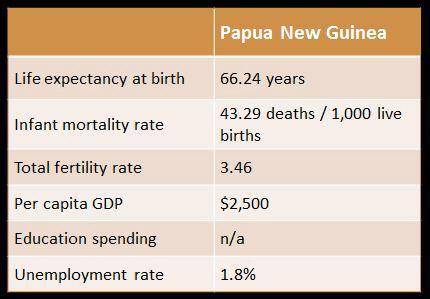
Analyze the chart below and answer the question that follows.
A 2-column table with 6 ro...

Social Studies, 28.05.2020 04:57 snowww5492
Analyze the chart below and answer the question that follows.
A 2-column table with 6 rows. Column 1 has entries Life expectancy at birth, Infant mortality rate, Total fertility rate, Per capita G D P, Education spending, Unemployment rate. Column 2 is labeled Papua New Guinea with entries 66.24 years, 43.29 deaths per 1,000 live births, 3.46, 2,500 dollars, not available, 1.8 percent.
Data courtesy of the CIA World Factbook
The indicators on the chart above tell us that the standard of living is _ in Papua New Guinea.
A.
very high
B.
high
C.
medium or average
D.
low


Answers: 2


Other questions on the subject: Social Studies


Social Studies, 23.06.2019 10:20, melinasilerox9mjh
If you wish to make an explicit comparison of two dissimilar things without using like or as you would use the
Answers: 3

Social Studies, 23.06.2019 11:00, TheOneandOnly003
Ineed finishing this i missed 4 days of school and missed out on a lot of reading
Answers: 1
You know the right answer?
Questions in other subjects:


History, 30.10.2020 07:50

Arts, 30.10.2020 07:50


History, 30.10.2020 07:50

Mathematics, 30.10.2020 07:50

Mathematics, 30.10.2020 07:50


