
Social Studies, 11.02.2020 21:30 02s54mcoupe
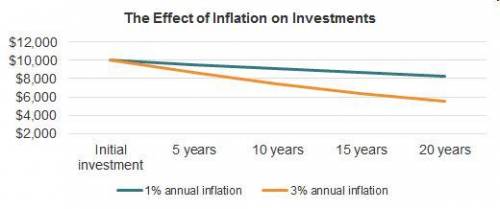
The graph shows the effect of inflation. A graph titled The Effect of Inflation on Investments has a length of the investment in years on the x-axis and the value in dollars on the y-axis. The initial investment is 10,000 dollars. With a 3 percent annual inflation, the amount at 5 years is 9,000 dollars, at 10 years is 7,500 dollars, at 15 years is 6,000 dollars, and 20 years is 5,800 dollars. With 1 percent annual inflation, the amount at 5 years is 9,500 dollars, at 10 years is 9,000 dollars, at 15 years is 8,200 dollars, and 20 years is 8,000 dollars. Approximately how much of the initial investment’s value would be lost after 15 years at 3% inflation?
A) 15%
B) 20%
C) 40%
D) 50%
Please hurry!

Answers: 3


Other questions on the subject: Social Studies
Social Studies, 22.06.2019 22:30, alexandraparava
Pls will give brainliest and 5star asap pls
Answers: 1
Social Studies, 23.06.2019 01:30, zekrader18
One result of recent migration trends is that the workforce in europe has become
Answers: 3
Social Studies, 23.06.2019 03:00, slyspy3002
Why has there been an increase in the older population within our prisons?
Answers: 2
You know the right answer?
The graph shows the effect of inflation. A graph titled The Effect of Inflation on Investments has a...
Questions in other subjects:

Social Studies, 08.10.2019 15:50
Mathematics, 08.10.2019 15:50


Social Studies, 08.10.2019 15:50
Mathematics, 08.10.2019 15:50


