

Answer the questions based off the graph.
1. What is shown on the X axis of this graph?
A. T...

SAT, 03.12.2021 07:00 jadalawler3
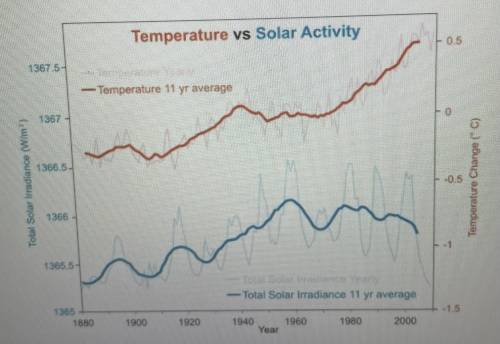
Answer the questions based off the graph.
1. What is shown on the X axis of this graph?
A. Temperature Change B. Year C. Solar irradiance or. D. Temperature vs solar activity
2. What is the average temperature reading in (oC) for the year 2000? (This is an estimate choose the number that would be closest)
A.-0.75. B.-0.49 C.0.5 or D.0.55
3.What year is tempature change average at its highest?
A. 1960 B. 1940 c. 2000 or d.1980
4. What year is solar irradiance at its highest?
A.1960
B.1940
C.2000
D.1980
Answers: 3


Other questions on the subject: SAT
SAT, 26.06.2019 13:30, broyochey1
Auser wants to add a thick, dark green border around a chart in powerpoint. the user can do this in chart tools by choosing what
Answers: 1
SAT, 26.06.2019 18:30, Giovanni0312
The press is free to say whatever they want about whomever they want, regardless of whether they know it’s true. true false
Answers: 1
SAT, 28.06.2019 12:10, ahoney2233
31. all the following are effective ways of preparing for an interview except practicing in front on a mirror writing down answers to possible questions holding a mock interview with a friend memorizing interview questions and answers
Answers: 1
SAT, 28.06.2019 17:30, jj11vb
Julia went to work for a reputed company. under pressure from upper management to cut costs, she directed line employees to ignore some safety precautions, which increased productivity. which argument of institutional anomie theory does this support? businesses set effective moral examples. businesses resort to illegal means to earn profits. businesses focus on public welfare. businesses fairly distribute profits. businesses employ only legal means to earn profits.
Answers: 1
You know the right answer?
Questions in other subjects:


Mathematics, 07.10.2019 17:30

History, 07.10.2019 17:30
Mathematics, 07.10.2019 17:30
Biology, 07.10.2019 17:30
History, 07.10.2019 17:30


