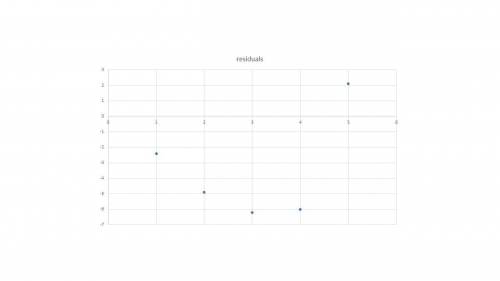
Find the residual values, and use the graphing calculator tool to make a residual plot.
A 4-column table with 5 rows. The first column is labeled x with entries 1, 2, 3, 4, 5. The second column is labeled given with entries negative 3.5, negative 2.9, negative 1.1, 2.2, 3.4. The third column is labeled predicted with entries negative 1.1, 2, 5.1, 8.2, 1.3. The fourth column is labeled residual value with all entries blank.
Does the residual plot show that the line of best fit is appropriate for the data?
Yes, the points have no pattern.
No, the points are evenly distributed about the x-axis.
No, the points are in a linear pattern.
Yes, the points are in a curved pattern.

Answers: 3


Other questions on the subject: SAT


SAT, 24.06.2019 15:30, hidais
What dose sat mean what dose sat mean what dose sat mean what dose sat mean what dose sat mean what dose sat mean what dose sat mean what dose sat mean what dose sat mean what dose sat mean what dose sat mean what dose sat mean what dose sat mean what dose sat mean what dose sat mean what dose sat mean what dose sat mean what dose sat mean what dose sat mean what dose sat mean what dose sat mean what dose sat mean
Answers: 2

SAT, 27.06.2019 01:30, taylor825066
Which of the following is not a component of your high school transcripts? a. courses you have enrolled in for the current year b. courses you have completed c. your cumulative gpa d. varsity sports you have played
Answers: 2
You know the right answer?
Find the residual values, and use the graphing calculator tool to make a residual plot.
...
...
Questions in other subjects:


Mathematics, 19.06.2020 13:57


Biology, 19.06.2020 13:57


