
SAT, 26.06.2019 05:00 nayelimoormann
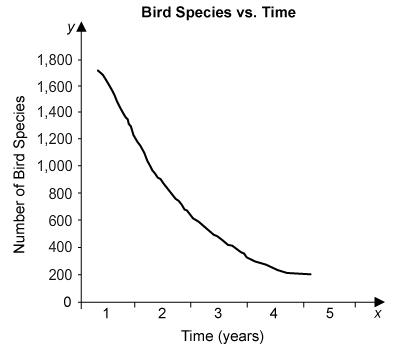
The graph shows a trend in an ecosystem over time caused by increased pollution in the region. what can you conclude from the graph? a. there’s lower biodiversity among birds. b. there’s a higher reproductive rate among birds. c. there’s a significant decline in the number of producers. d. other types of animals were unaffected by pollution.
Answers: 1


Other questions on the subject: SAT
SAT, 28.06.2019 14:30, christian2510
Aside form a students id, what is another card a collage student use to obtain discounts
Answers: 2
SAT, 29.06.2019 12:00, timothyashburn8
Saul reaches out to grab a pot of boiling water and something in his body sends a sensation to his brain to warn him of the heat coming from the handle. what organ is responsible for protecting saul from the heat?
Answers: 1
SAT, 30.06.2019 00:00, dianepowers1
Wiosiy tost type the correct answer in the box. spell all words correctly. which economy enables demand for a product or service to drive all the business decisions? business decisions are driven by demand in a (an) economy reset next
Answers: 1
You know the right answer?
The graph shows a trend in an ecosystem over time caused by increased pollution in the region. what...
Questions in other subjects:

SAT, 08.02.2021 18:40

Mathematics, 08.02.2021 18:40


Mathematics, 08.02.2021 18:40
Mathematics, 08.02.2021 18:40

Arts, 08.02.2021 18:40


