
SAT, 26.06.2019 05:30 tiniecisneros28
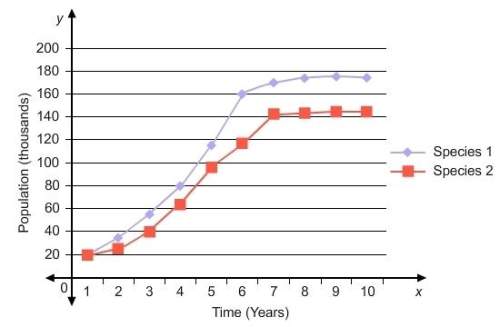
The graph shows the populations of two species over time. which type of symbiotic relationship does the graph represent? a. commensal b. mutualistic c. parasitic d. parent-offspring e. predator-prey
Answers: 1


Other questions on the subject: SAT
SAT, 26.06.2019 09:30, tiannacorreastamas
What is the highest grade you can score on the act
Answers: 2
SAT, 01.07.2019 12:30, ethangeibel007
How many words can your film studies a2 screenplay be?
Answers: 1
SAT, 01.07.2019 13:00, genyjoannerubiera
Which option describes the most cost-effective way for a skateboard company to purchase plywood?
Answers: 1
You know the right answer?
The graph shows the populations of two species over time. which type of symbiotic relationship does...
Questions in other subjects:


Law, 15.12.2020 20:30

Arts, 15.12.2020 20:30

Mathematics, 15.12.2020 20:30
Mathematics, 15.12.2020 20:30
Mathematics, 15.12.2020 20:30
Mathematics, 15.12.2020 20:30


