
Physics, 17.09.2021 03:10 esmemaluma00
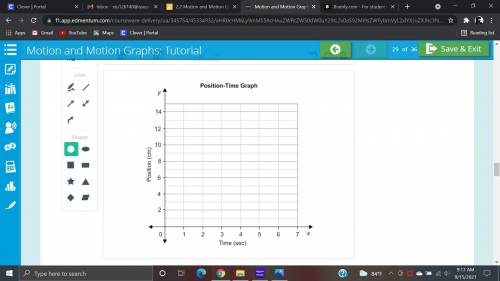
The position data for line 2 was recorded in 1-second intervals. Draw a graph with distance on the y-axis and elapsed time on the x-axis. Reference all distance and time measurements to dot 1. To plot a point, use the circle tool. To draw a line between points, use the line tool. To move a point or line, use the select tool.

Answers: 1


Other questions on the subject: Physics
Physics, 22.06.2019 05:40, laurelbrasi
The difference between a red shift and a blue shift has to do with wavelength frequency. t or f
Answers: 1
Physics, 22.06.2019 07:30, anonymous1813
Some material consisting of a collection of microscopic objects is kept at a high temperature. a photon detector capable of detecting photon energies from infrared through ultraviolet observes photons emitted with energies of 0.3 ev, 0.5 ev, 0.8 ev, 2.0ev, 2.5ev, and 2.8ev. these are the only photon energies observed. (a) draw and label a possible energy-level diagram for one of the microscopic objects, which has four bound states. on the diagram, indicate the transitions corresponding to the emitted photons. explain briefly. (b) would a spring–mass model be a good model for these microscopic objects? why or why not? (c) the material is now cooled down to a very low temperature, and the photon detector stops detecting photon emissions. next, a beam of light with a continuous range of energies from infrared through ultraviolet shines on the material, and the photon detector observes the beam of light after it passes through the material. what photon energies in this beam of light are observed to be significantly reduced in intensity (“dark absorption lines”)? explain briefly.
Answers: 3
You know the right answer?
The position data for line 2 was recorded in 1-second intervals. Draw a graph with distance on the y...
Questions in other subjects:

Mathematics, 07.01.2021 04:00
Mathematics, 07.01.2021 04:00

English, 07.01.2021 04:00


Medicine, 07.01.2021 04:00
Mathematics, 07.01.2021 04:00
Health, 07.01.2021 04:00

English, 07.01.2021 04:00


