
Physics, 22.07.2021 03:20 eddrekas8564
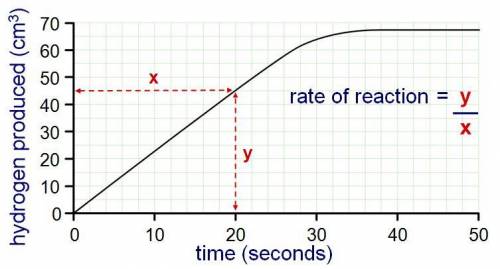
In the graph below, why does the graph stop increasing after 30 seconds?
A. The hydrogen gas is absorbing heat to undergo a phase change.
B. A catalyst needs to be added to increase the amount of hydrogen produced.
C. No more hydrogen can be produced because all of the reactants have become products at this point.
D. It has reached the maximum amount of product it can make at this temperature. The temperature would need to increase to produce more.

Answers: 1


Other questions on the subject: Physics
Physics, 22.06.2019 05:10, blondesaturn
Waves are used in many practical applications to support work, entertainment, and health. one example is the use of ultrasound imaging to safely track the development of a growing fetus. what is a specific example of a practical application of waves in medicine, entertainment, safety, or other fields? provide a brief explanation of how the properties of waves are useful to that application.
Answers: 3
Physics, 22.06.2019 11:30, genyjoannerubiera
A100-watt light bulb illuminates a solar cell. the electricity from the solar cell operates a water pump that delivers 1 watt of power. what is the efficiency of the system?
Answers: 2
You know the right answer?
In the graph below, why does the graph stop increasing after 30 seconds?
A. The hydrogen gas is a...
Questions in other subjects:


Mathematics, 06.01.2021 21:10

English, 06.01.2021 21:10


