The graph indicates Linda’s walk.
Which best describes the graph?
Linda started out mov...

The graph indicates Linda’s walk.
Which best describes the graph?
Linda started out moving, and then stopped moving after 6 seconds.
Linda started moving away from the start point, and then moved closer.
Linda never moved the entire trip.
Linda’s path results in a negative slope.
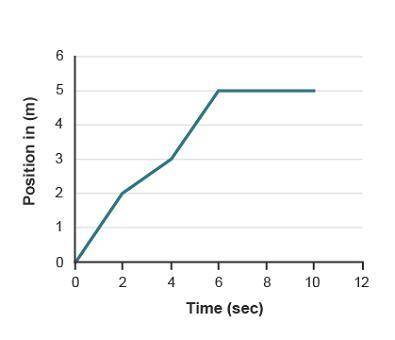

Answers: 2


Other questions on the subject: Physics
Physics, 21.06.2019 20:20, pamelperezz26
Ateam of astronauts is on a mission to land on and explore a large asteroid. in addition to collecting samples and performing experiments, one of their tasks is to demonstrate the concept of the escape speed by throwing rocks straight up at various initial speeds. with what minimum initial speed vesc will the rocks need to be thrown in order for them never to "fall" back to the asteroid? assume that the asteroid is approximately spherical, with an average density p 3.84 x10⁸ g/m3 and volume v 2.17 x 10¹² m3 recall that the universal gravitational constant is g 6.67 x 10⁻¹¹ n m2/kg2
Answers: 2
Physics, 21.06.2019 21:50, yairreyes01
Adiver in midair has an angular velocity of 6.0 rad/s and a moment of inertia of 1.2 kg·m2. he then pulls is arms and legs into a tuck position and his angular velocity increases to 12 rad/s. the net external torque acting on the diver is zero. what is his moment of inertia in the tuck position?
Answers: 1
Physics, 21.06.2019 22:30, droidd133
Fft review: linspace, fs, fftshift, nfft 1. generate one second of a cosine of w,-10hz sampled at f, = 100hz and assign it to x. define a tt as your time axis 2. take 64 points fft. 3. as you remember, the dft (which the fft implements) computes n samples of s2t where k-0,1,2, n -1. plot the magnitude of this 64-points fft at range 0 to 63, what do you think of this graph? 4â·to get the x-axis into a hz-frequency form, plot this 64-points fft between-50 to 50 (the 100hz sampling rate) and have n-points between them. 5. according to your figure, what frequency is this cosine wave at? 6. remember that the fft is evaluating from 0 to 2ď€. we are used to viewing graphs from-ď€ to ď€. therefore, you need to shift your graph. 7. now according to your shifted graph. what frequency is this at? 8. note that the spikes have long drop-offs? try a 1024-point dft. note that the peak is closer to 10 and the drop-off is quicker. although, now sidelobes are an issue
Answers: 2
You know the right answer?
Questions in other subjects:


Health, 14.12.2021 16:50
Physics, 14.12.2021 16:50


Chemistry, 14.12.2021 16:50
Mathematics, 14.12.2021 16:50
Mathematics, 14.12.2021 16:50


