This graph shows how tall five types of trees were after they grew for 10 years.
which statem...

Physics, 30.12.2019 16:31 kelsgoat22
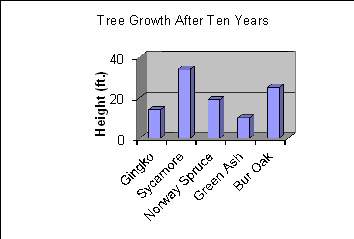
This graph shows how tall five types of trees were after they grew for 10 years.
which statement correctly describes the data shown in the graph and the type of observation used?
a. the ginkgo tree grew 14 feet; this is a qualitative observation.
b. the bur oak tree’s growth rate averaged 2.5 feet per year; this is a quantitative observation.
c. the bur oak tree is twice the height of the ash tree; this is a qualitative observation.
d. the norway spruce grew more slowly than the sycamore every year; this is quantitative data.

Answers: 2


Other questions on the subject: Physics
Physics, 21.06.2019 23:00, ImBADatmath8743
Asubmarine has a "crush depth" (that is, the depth at which water pressure will crush the submarine) of 250 m. what is the approximate pressure (water plus atmospheric) at this depth? (recall that the density of seawater is 1025 kg/m3, g = 9.81 m/s2, and 1 kg/(ms2) = 1 pa = 9.8692 10-6 atm.) a. 34.8 atm b. 24.8 atm c. 25.8 atm d. 7.8 atm
Answers: 2
Physics, 22.06.2019 10:00, kaniyawilhite
If a stone with an original velocity of 0 is falling from a ledgeand takes 8 seconds to hoybthe ground whays the final velocity of the stone
Answers: 2
Physics, 22.06.2019 11:30, emily965692
Where is the potential energy throughout the loading, cocking, and releasing of the trebuchet?
Answers: 2
You know the right answer?
Questions in other subjects:

English, 14.10.2019 06:20

Mathematics, 14.10.2019 06:20


Social Studies, 14.10.2019 06:20
Mathematics, 14.10.2019 06:20

History, 14.10.2019 06:20


