
Physics, 11.01.2021 19:50 4tazaouiamine1r
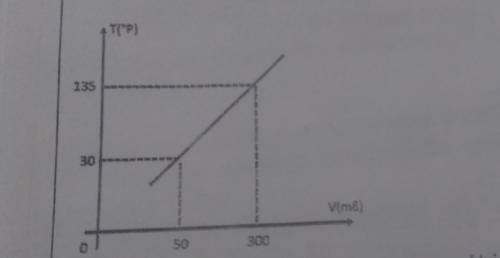
The diagram below shows the relationship between the volume v of a gas in a constant pressure gas thermometer and the corresponding temperature on an arbitrary T scale, calibrated in ° P
A) Determine the thermometric function for that device
B) Determine the temperature indicated by the device in ° P, when the gas volume is 1440ml
C) For a temperature of 1350 ° P, determine the new gas volume

Answers: 1


Other questions on the subject: Physics
Physics, 23.06.2019 07:00, cdjeter12oxoait
Roger pushes a box on a 30° incline. if he applies a force of 60 newtons parallel to the incline and displaces the box 10 meters along the incline, how much work will he do on the box? a. 5.2 × 10² joules b. 6.0 × 10² joules c. -5.2 × 10² joules d. -6.0 × 10² joules
Answers: 3
You know the right answer?
The diagram below shows the relationship between the volume v of a gas in a constant pressure gas th...
Questions in other subjects:


Mathematics, 25.09.2020 18:01
Mathematics, 25.09.2020 18:01

History, 25.09.2020 18:01

History, 25.09.2020 18:01
Mathematics, 25.09.2020 18:01

Business, 25.09.2020 18:01


