
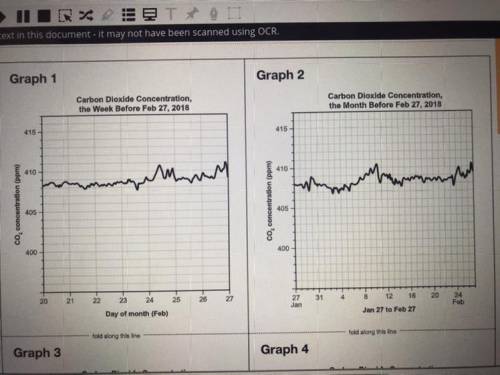
5. The Mauna Loa Observatory in Hawaii has been monitoring atmospheric levels of carbon dioxide since 1958.
Examine Appendix A, Keeling Curve Graphs. Graphs 1 and 2 represent the data collected at this observatory
over a period of a week and a month. Write down what you notice, if anything, about the concentration of
carbon dioxide.

Answers: 1


Other questions on the subject: Physics
Physics, 22.06.2019 04:00, binodkharal2048
Which configuration would produce an electric current? a) rotate a coil of copper wire between two magnets. b) connect a wire between a copper and zinc strip sitting in a beaker of water. c) connect a wire to the (+) positive end of a battery and the other end to a light bulb. d) connect a wire to the negative end of a battery and the other end to a light bulb.
Answers: 2
You know the right answer?
5. The Mauna Loa Observatory in Hawaii has been monitoring atmospheric levels of carbon dioxide sinc...
Questions in other subjects:


Mathematics, 26.09.2019 16:20

Spanish, 26.09.2019 16:30


