
Physics, 14.12.2020 16:50 kmassarotti
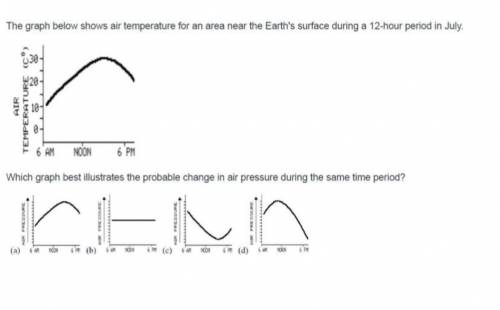
The graph below shows air temperature for an area near the Earth's surface during a 12-hour period in July. Which graph best illustrates the probable change in air pressure during the same time period?

Answers: 3


Other questions on the subject: Physics
Physics, 22.06.2019 13:40, sbudlove2838
What is the thinnest soap film (excluding the case of zero thickness) that appears black when illuminated with light with a wavelength of 480 ? the index of refraction of the film is 1.34, and there is air on both sides of the film. express your answer in nanometers. hint 1. how to approach th
Answers: 1
Physics, 22.06.2019 19:30, cecelia090
Another word for electromagnetic energy is a. heat b. force c. matter d. radiation
Answers: 1
Physics, 23.06.2019 00:00, aidanfbussiness
Abus travels 280km south along a straight path with an average velocity of 88km/h to the south. the bus stops for 24 min, then it travels 210 km south with an average velocity of 75 km/h to the south. how long does the total trip last?
Answers: 1
Physics, 23.06.2019 02:10, eddiecas
The average atmospheric pressure on earth is approximated as a function of altitude by the relation patm = 101.325 (1 − 0.02256z)5.256, where patm is the atmospheric pressure in kpa, and z is the altitude in km with z = 0 at sea level. determine the approximate atmospheric pressures at atlanta (z = 306 m), denver (z = 1610 m), mexico city (z = 2309 m), and the top of mount everest (z = 8848 m).
Answers: 3
You know the right answer?
The graph below shows air temperature for an area near the Earth's surface during a 12-hour period i...
Questions in other subjects:


Biology, 28.06.2019 20:10
Mathematics, 28.06.2019 20:10


Mathematics, 28.06.2019 20:10
Mathematics, 28.06.2019 20:10
Mathematics, 28.06.2019 20:10


