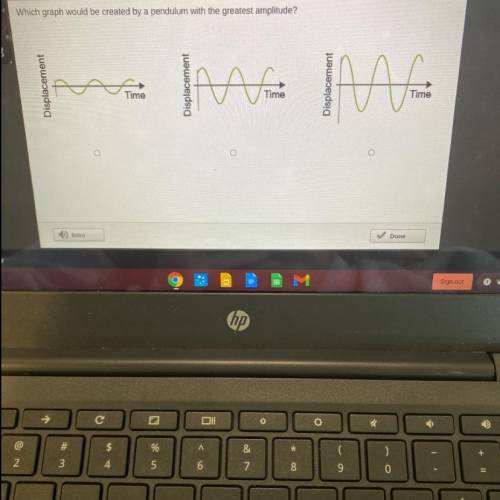
Which graph would be created by the pendulum with the greatest amplitude?
...

Physics, 27.10.2020 19:10 shybunny7568
Which graph would be created by the pendulum with the greatest amplitude?

Answers: 3


Other questions on the subject: Physics
Physics, 22.06.2019 17:30, babygreg2001p97abr
Current from a charged capacitor lights a bulb. as time goes on the brightness of the
Answers: 3
Physics, 22.06.2019 22:00, natalie2sheffield
Aparticle of mass m is placed in a one-dimensional box of length l. the box is so small that the particle’s motion is relativistic, so that e p2/2m is not valid. (a) derive an expression for the energy levels of the particle using the relativistic energy–momentum relation and the quantization of momentum that derives from connement. (b) if the particle is an electron in a box of length l 1.00 1012 m, nd its lowest possible kinetic energy. by what percent is the nonrelativistic formula for the energy in error?
Answers: 1
Physics, 23.06.2019 02:10, Nathaliasmiles
Find the steady-state temperature at the center of the plate = /2, = /2) for sums of w from n=1 to n=19 (only odd values). find the value of n for which the change in /2, /2) is less than 1% from the value at the previous n. at this point, we consider the solution converged. does the value of the temperature at the center seem reasonable? in this part, the values of x and y are constant scalar values. you should produce a plot of the value of n on the horizontal and the estimate of the temperature at the center of the plate on the vertical. b. using the value of n (or larger) that resulted in convergence in part (a), create a contourf plot of the temperature distribution across the entire plate. use enough spatial subdivisions to create a useful plot. comment on the results. hint: you need to determine what “x” and “y” values to use to make your t matrix. i recommend using a different number of x and y values. use enough x and y values so that the plot is “smooth”.
Answers: 1
You know the right answer?
Questions in other subjects:

Mathematics, 28.08.2021 01:40

History, 28.08.2021 01:40
History, 28.08.2021 01:40


Chemistry, 28.08.2021 01:40
Mathematics, 28.08.2021 01:40


