
 are the coordinates of the 1st point
 are the coordinates of the 2nd point
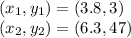


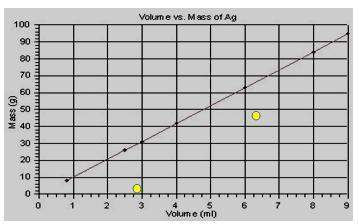
Use the graph attached below.
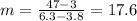
a. calculate the slope of the trend line. use the yellow d...

Physics, 10.10.2019 02:00 ashleypere99
Use the graph attached below.
a. calculate the slope of the trend line. use the yellow dots.
b. in this graph (mass vs volume), what does the slope represent?
!

Answers: 2


Other questions on the subject: Physics
Physics, 22.06.2019 18:30, Kittylover65
Blood pressure the total amount of blood the heart pumps in one minute 2. cardiac output the number of times your heart beats in a minute 3. dilate the amount of blood that the heart can pump in a single beat 4. heart rate the force exerted on the walls of the blood vessels by the blood that moves through them 5. stroke volume to widen or get larger in size
Answers: 3
Physics, 22.06.2019 22:00, kelsea86
The pilot of a helicopter hovers at an altitude of 1200 feet over a park. the angle of depression to the base of a statue is 17 degrees. the angle of depression to the nearest park exit, in line with the statue, is 14 degrees. to the nearest foot, what is the distance from the statue to the exit?
Answers: 1
You know the right answer?
Questions in other subjects:


Computers and Technology, 29.08.2019 18:00

History, 29.08.2019 18:00
Mathematics, 29.08.2019 18:00
Mathematics, 29.08.2019 18:00


