
Physics, 14.09.2019 07:30 desireawhatspoppin
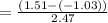
Abusy chipmunk runs back and forth along a straight line of acorns that has been set out between his burrow and a nearby tree. at some instant the little creature moves with a velocity of -1.03 m/s. then, 2.47 s later, it moves at the velocity 1.51 m/s. what is the chipmunk\'s average acceleration during the 2.47-s time interval?

Answers: 2


Other questions on the subject: Physics
Physics, 22.06.2019 16:40, jcblake
Beryl states that insulation with the smallest possible thermal conductivity is best to keep a house warm in winter, but worst for keeping a house cool in summer. sapphire insists the reverse is true: low thermal conductivity is good in the summer, but bad in the winter. which one, if either is correct? a. beryl, because low thermal conductivity results in low heat transfer. b. beryl, because low thermal conductivity results in high heat transfer. d. sapphire, because low thermal conductivity results in high heat transfer. e. neither, because low heat transfer is desirable both in summer and in winter.
Answers: 2
Physics, 22.06.2019 18:50, rurbanok12
8.29 two streams containing pyridine and acetic acid at 25°c are mixed and fed into a heat exchanger. due to the heat-of-mixing effect, it is desired to reduce the temperature after mixing to 25°c using a stream of chilled ethylene glycol as indicated in the diagram. calculate the mass flow rate of ethylene glycol needed. the heat capacity of ethylene glycol at these conditions is approximately 2.8 kj/(kg k), and the enthalpy change of mixing (δmixh) is given below.
Answers: 3
Physics, 22.06.2019 23:00, brooke0713
As seen in a us weather map, the h (or high) and l (or low) symbols indicate regions where surface air pressures are high or low, respectively, compared to surrounding areas. an h is plotted where the air pressure is highest and an l is plotted where the air pressure is lowest. proceeding outward and away from the center of a high pressure system, the air pressure "
Answers: 1
You know the right answer?
Abusy chipmunk runs back and forth along a straight line of acorns that has been set out between his...
Questions in other subjects:

Mathematics, 18.09.2019 06:00


History, 18.09.2019 06:00
History, 18.09.2019 06:00
Mathematics, 18.09.2019 06:00
Mathematics, 18.09.2019 06:00

English, 18.09.2019 06:00


