
Mathematics, 22.07.2019 00:32 foxesforlife45
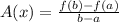
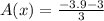
The graph shows the function f(x). which value is closest to the average rate of change from x = 1 to x = 4? a.−3.5 b.−2.3 c. −1.4 d .−0.3

Answers: 1
 ....[1]


Other questions on the subject: Mathematics
Mathematics, 21.06.2019 14:30, Carrchris021
Because of your favorite lemonade it is $3.84 for 3 gallons. write this as an unit rate
Answers: 2
Mathematics, 21.06.2019 23:10, krystalhurst97
What is the distance between the points (2, 5) and (5,9)?
Answers: 1
You know the right answer?
The graph shows the function f(x). which value is closest to the average rate of change from x = 1...
Questions in other subjects:

History, 24.07.2019 15:00


History, 24.07.2019 15:00
Social Studies, 24.07.2019 15:00


