
Mathematics, 22.07.2019 06:00 savannahwonder
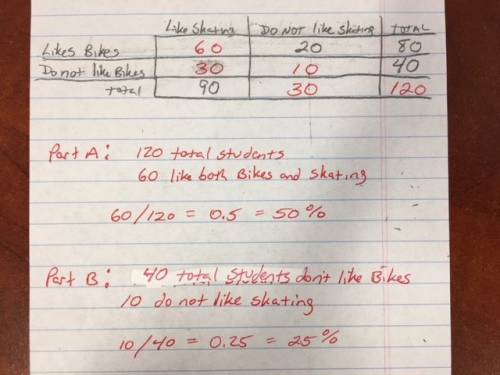
Agroup of students were surveyed to find out if they like bike riding and/or roller skating as a hobby. the results of the survey are shown below: 80 students like bike riding 20 students like bike riding but do not like skating 90 students like skating 40 students do not like bike riding make a two-way table to represent the data and use the table to answer the following questions. part a: what percentage of the total students surveyed like both bike riding and skating? show your work. (5 points) part b: what is the probability that a student who does not like bike riding also does not like skating? explain your answer. (5 points)

Answers: 2


Other questions on the subject: Mathematics
Mathematics, 22.06.2019 05:20, tannerlynn4320
(! ) the figure below shows parallelograms abce, pqrs, and tnlm on a coordinate plane. points s, p, q, and r are midpoints of abce t, n, l, and m are midpoints of pqrs write the equation of line ml. show your work.
Answers: 1
Mathematics, 22.06.2019 06:30, footboy773
Awalker is already walking 5km per day and decides to increase this amount by 0.1km per day starting on 1st august. what distance will he be walking on 3rd august? b. is this an arithmetic sequence? explain your reasoning. c. what is the formula for the nth term?
Answers: 3
Mathematics, 22.06.2019 07:00, willcohen42
Triangles abd and ace are similar right triangles. which best describes how to find the equation of the line?
Answers: 2
You know the right answer?
Agroup of students were surveyed to find out if they like bike riding and/or roller skating as a hob...
Questions in other subjects:

English, 09.04.2021 04:10


