
Mathematics, 23.07.2019 17:00 rprest00
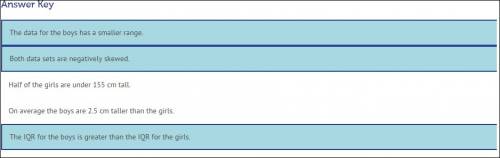
Compare the data sets of student's heights represented by the box plots. click to select the correct answers. the data for the boys has a smaller range. both data sets are negatively skewed. half of the girls are under 155 cm tall. on average the boys are 2.5 cm taller than the girls. the iqr for the boys is greater than the iqr for the girls.

Answers: 1


Other questions on the subject: Mathematics
Mathematics, 21.06.2019 14:30, mustachegirl311
Use the multiplier method to incrases £258 by 43%
Answers: 1
Mathematics, 21.06.2019 23:00, maiacheerz
12 out of 30 people chose their favourite colour as blue caculate the angle you would use for blue on a pie chart
Answers: 1
You know the right answer?
Compare the data sets of student's heights represented by the box plots. click to select the correct...
Questions in other subjects:

Geography, 07.01.2021 21:20
Mathematics, 07.01.2021 21:30


Biology, 07.01.2021 21:30
Mathematics, 07.01.2021 21:30


