
Mathematics, 18.11.2019 02:31 krystalhurst97
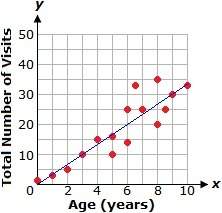
The graph below shows a scatter plot and the line of best fit relating the ages of children and the total number of times they have visited the doctor.
use the line of best fit to estimate the age of a child who has visited the doctor 40 times.
13 years old
11 years old
14 years old
12 years old

Answers: 3


Other questions on the subject: Mathematics
Mathematics, 20.06.2019 18:04, izabelllreyes
Rosa makes a small flower garden outside the clubhouse the area of the garden is 851 square meters if the length of the garden is 23 m what is the width of the garden
Answers: 1
Mathematics, 21.06.2019 18:30, Raewolf25
Need an artist designed a badge for a school club. figure abcd on the coordinate grid below shows the shape of the badge: the badge is enlarged and plotted on the coordinate grid as figure jklm with point j located at (2, -2) and point m is located at (5, 4). which of these could be the coordinates for point l? a. (2, 4) b. (8, 4) c. (5, 1) d. (5, 7)
Answers: 2
You know the right answer?
The graph below shows a scatter plot and the line of best fit relating the ages of children and the...
Questions in other subjects:

Biology, 13.07.2021 03:50

English, 13.07.2021 03:50
Mathematics, 13.07.2021 03:50
Mathematics, 13.07.2021 03:50

Business, 13.07.2021 03:50


