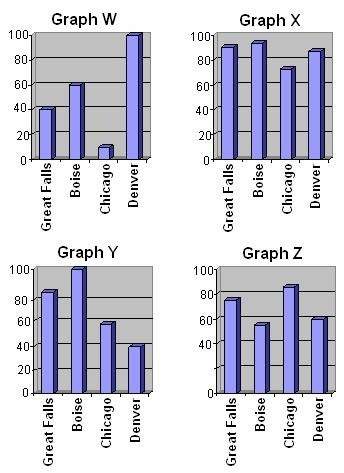
Which bar graph best represents the data shown on the map?
a.
graph z
b.
...

Mathematics, 14.11.2019 00:31 rvj0444073603
Which bar graph best represents the data shown on the map?
a.
graph z
b.
graph x
c.
graph w
d.
graph y


Answers: 1


Other questions on the subject: Mathematics
Mathematics, 21.06.2019 20:00, brittanybyers122
Which type of graph would allow us to compare the median number of teeth for mammals and reptiles easily
Answers: 2
Mathematics, 21.06.2019 23:00, rickespey9037
Rob filled 5 fewer plastic boxes with football cards than basketball cards. he filled 11 boxes with basketball cards.
Answers: 1
Mathematics, 22.06.2019 01:30, nickeymcorrea
The pyraminx is a rubik's cube-type toy in the shape of a tetrahedron. the pyraminx shown below has edges 15\,\text{cm}15cm long and vertical height h=12.2\,\text{cm}h=12.2cm. the triangle drawn with dashed lines is a right triangle. what is the distance rr? round your answer to the nearest tenth.
Answers: 1
Mathematics, 22.06.2019 03:20, ashleewilson9204
Atotal of 505 tickets were sold for a school play they were either adult tickets or student tickets they were 55 more student tickets so than adult tickets how many adult tickets were sold ?
Answers: 2
You know the right answer?
Questions in other subjects:

Mathematics, 01.09.2019 19:50

Mathematics, 01.09.2019 19:50
Mathematics, 01.09.2019 19:50
History, 01.09.2019 19:50

Health, 01.09.2019 19:50


