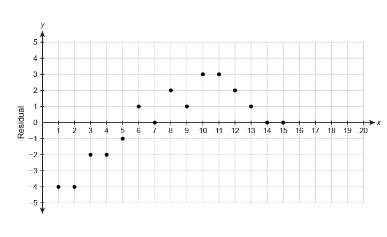
The residual plot for a data set is shown.
based on the residual plot, which statement b...

Mathematics, 22.12.2019 12:31 babygurl27732
The residual plot for a data set is shown.
based on the residual plot, which statement best explains whether the regression line is a good model for the data set and why?
the regression line is a good model because some residuals are 0.
the regression line is not a good model because the points in the residual plot are far from the x-axis.
the regression line is a good model because the residuals approach 0 as x increases.
the regression line is not a good model because there is a pattern in the residual plot.

Answers: 3


Other questions on the subject: Mathematics
Mathematics, 21.06.2019 17:00, marciekinser
Solve with work adding cheese to a mcdonalds quarter pounder increases the fat content from 21g to 30g. what is the percent of change ?
Answers: 2
Mathematics, 21.06.2019 17:40, kazmiere2005oye9tz
Afamily of five rents a kayak and splits the total time, k, equally. each family member spent less than 25 minutes kayaking. which values can be used to complete the math sentence below so that it accurately represents the situation? intro done
Answers: 2
Mathematics, 21.06.2019 20:40, keananashville
The graph of a function f(x)=(x+2)(x-4). which describes all of the values for which the graph is negative and increasing? all real values of x where x< -2 all real values of x where -2
Answers: 2
You know the right answer?
Questions in other subjects:


Mathematics, 11.01.2021 20:00

Biology, 11.01.2021 20:00

Arts, 11.01.2021 20:00

Mathematics, 11.01.2021 20:00
Mathematics, 11.01.2021 20:00


