Mathematics, 01.10.2019 20:30 seymani2
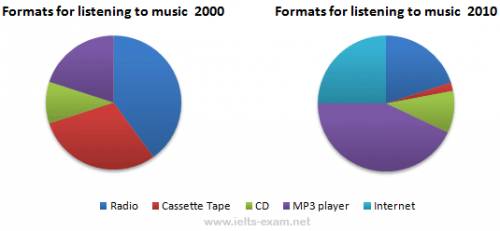
Which of the following types of diagrams is often the best for the skill of comparison and contrast?
a. pie chart.
c. venn diagram.
b. graph.
d. listing.

Answers: 1


Other questions on the subject: Mathematics

Mathematics, 21.06.2019 19:30, MariaIZweird7578
Combine the information in the problem and the chart using the average balance method to solve the problem.
Answers: 2


Mathematics, 22.06.2019 01:40, ashleygarcia0884
At wind speeds above 1000 centimeters per second (cm/sec), significant sand-moving events begin to occur. wind speeds below 1000 cm/sec deposit sand and wind speeds above 1000 cm/sec move sand to new locations. the cyclic nature of wind and moving sand determines the shape and location of large dunes. at a test site, the prevailing direction of the wind did not change noticeably. however, the velocity did change. fifty-nine wind speed readings gave an average velocity of x = 1075 cm/sec. based on long-term experience, σ can be assumed to be 245 cm/sec. (a) find a 95% confidence interval for the population mean wind speed at this site. (round your answers to the nearest whole number.) lower limit cm/sec upper limit cm/sec
Answers: 2

Mathematics, 22.06.2019 02:00, FaygoMango
Prove the following(cot0+cosec0)[tex](cot0 + cosec0) { }^{2} = \frac{1 + cos0}{1 - cos0} [/tex]
Answers: 1
You know the right answer?
Which of the following types of diagrams is often the best for the skill of comparison and contrast?...
Questions in other subjects:


English, 26.07.2019 18:30


Engineering, 26.07.2019 18:30


